

Aggregate demand: definition, formula and curve
The General Theory of Employment, Interest and Money was economist John Maynard Keynes’s crowning achievement. Following the book’s publication in 1936, it laid the foundations for the concepts of aggregate demand and aggregate supply. But what exactly is aggregate demand?
What is aggregate demand in economics?
Aggregate demand is the quantity of goods and services produced by a national economy that all agents, including foreigners, are willing to purchase during a specific period. This macroeconomic aggregate is composed of the sum of the individual needs of economic agents: households, businesses, the public sector and other actors. It’s also known by its acronym, AD.
Aggregate demand correlates directly with changes in the money supply, income and government spending. Inversely, it relates to prices and taxes. Its magnitude will always be equal to the gross domestic product (GDP), but its calculation perspective is different. While the GDP is measured taking into account the production of goods and services, aggregate demand considers their acquisition.
What’s the aggregate demand formula?
To calculate this indicator, you can employ the same methods used to determine the GDP. However, aggregate demand is computed from a consumption standpoint rather than concentrating on what society generates. Therefore, it considers aspects such as private expenditure outlays, investments, government spending and net exports.
This is the formula for calculating a country’s aggregate demand:
| AD = C + I + G + (X - M) |
It’s the sum of these components:
- Consumption (C). Money that families and individuals, i.e., households, spend on goods and services.
- Investment (I). Acquisitions made by businesses but also investments such as housing. As they’re usually financed by external resources, they depend directly on interest rates.
- Government spending (G). Cost of goods and services of general interest.
- Net exports (X - M). The difference between exports and imports.
What’s the aggregate demand curve?
Knowledge of this macroeconomic model helps distinguish between short-term economic fluctuations and understand how economic policies influence them. The AD curve depicts the relationship between the quantity of demanded goods and services and the aggregate price level in a scenario where, except for the price level (P) and the aggregate production level or real GDP (Y), all other factors remain unchanged. The graph below shows the number of products consumers are willing to purchase at each cost level.
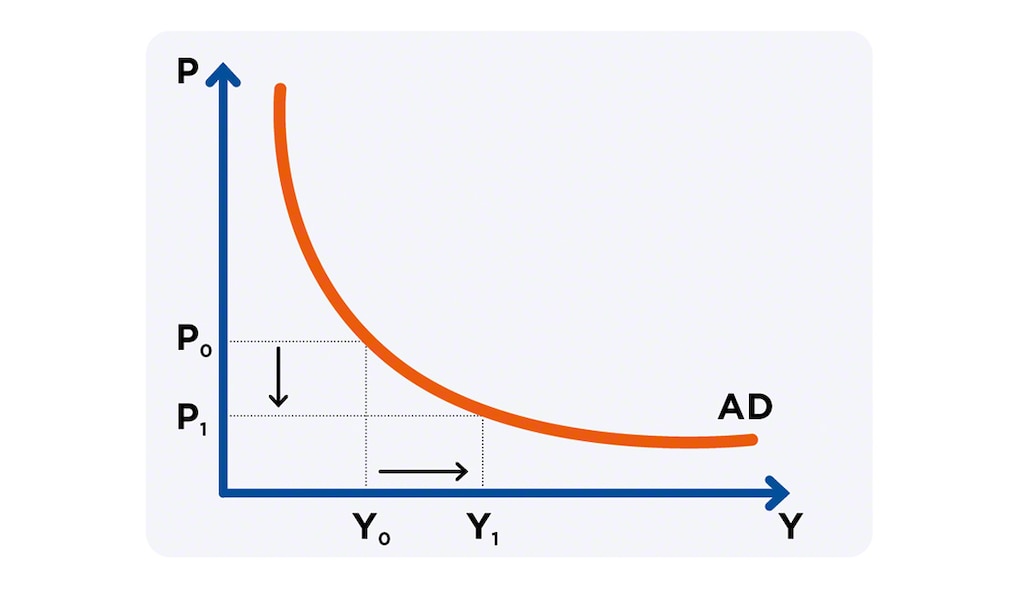
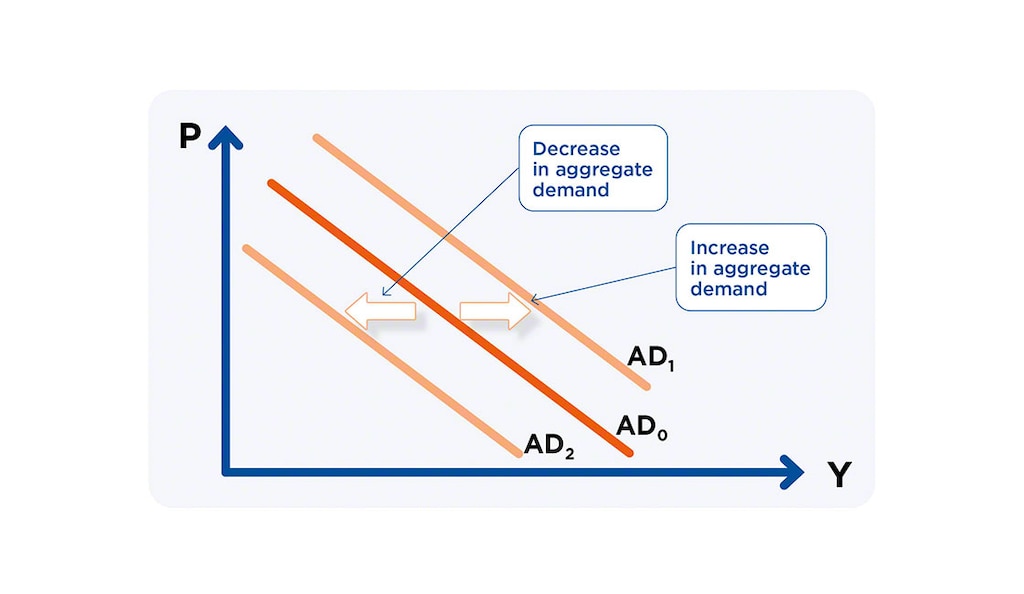
What happens when aggregate demand rises? In this case, the curve shifts to the right, meaning it increases for any price level. Conversely, if AD falls, the line moves to the left.
Other factors that cause the curve to shift typically include:
- Consumer expectations. If companies and individuals are optimistic about the economic situation, they’ll spend more.
- Wealth fluctuations. If household purchasing power rises, it becomes easier to boost aggregate demand.
- Changes in physical capital. With regard to businesses and if all other variables remain constant, money allocated to investments will depend on capital previously owned. Large expenditures often lead to stages marked by a decline in investment.
- Fiscal and monetary policy. The central bank and the public sector can adjust aggregate demand through restrictive policies (to reduce it) or expansive policies (to boost it).
- Global economy. Growth in the income of other countries can increase exports. The exchange rate is another element affecting a country’s sale of goods; when a nation’s currency becomes strong against other currencies, its exports tend to decline.
How does aggregate demand impact the economy?
The aggregate demand curve has a negative slope for three reasons:
- Wealth effect. When prices for goods and services are low, people feel more affluent and are inclined to spend more.
- International trade effect. When prices go down and domestic goods and services are cheaper than their foreign counterparts, exports increase.
- Interest-rate (Keynes) effect. As purchasing power is enhanced, families make less effort to buy goods and services. This allows banks to allocate more money to loans, causing interest rates to fall. In turn, this scenario encourages companies and households to invest more.
Data for interpreting aggregate demand
Supply chain managers must be able to interpret aggregate demand to implement demand planning as effectively as possible. This allows for accurate stock forecasting, lean inventory management and realistic expenditure and revenue estimates. However, to achieve this, managers require access to up-to-date databases.
Using software like a warehouse management system (WMS) benefits business efficiency, helping companies streamline their supply chains. At Mecalux, we specialise in implementing these types of programs in addition to warehouse automation projects. We can help you successfully tackle future spikes in order volumes. Be sure to reach out to our experts for personalised advice on optimising your logistics processes.